
Nearly one in seven members of the global marketing industry say they would leave our industry on the back of a lack of diversity, equity and inclusion, according to responses to the 2023 Global DEI Census.
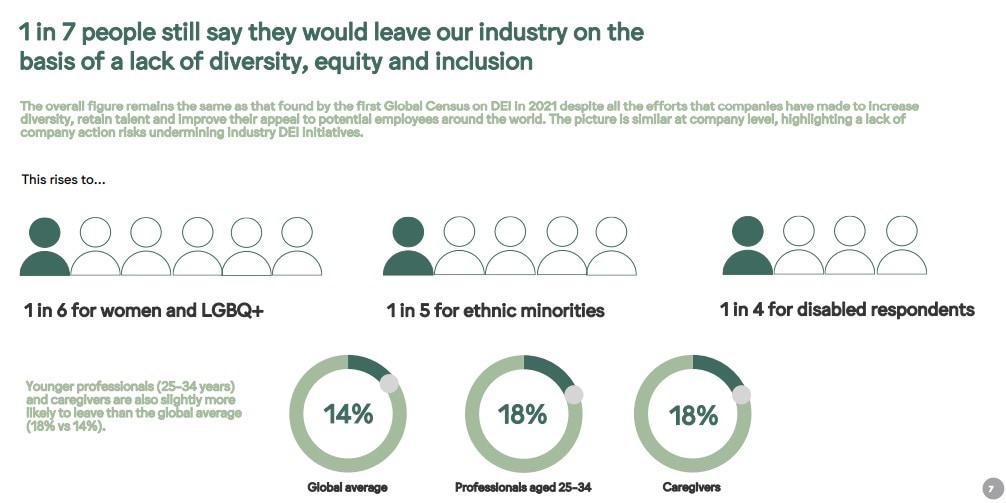
The picture is even worse among certain groups, with 16 percent of women, 17 percent of LGBQ+, 22 percent of ethnic minorities and 24 percent of disabled respondents (almost 1 in 4), say they are likely to leave.
Younger professionals between the age of 25-34 years and caregivers are also slightly more likely to leave than the global average (18 percent vs 14 percent).
The overall one in seven figure remains the same as that found by the first Global Census on DEI in 2021. This is despite all the efforts that companies have made to increase diversity, retain talent and improve their appeal to potential employees around the world.
Those efforts are recognised, however, with 72 percent respondents globally acknowledging industry attempts to improve the lived experiences of key groups. The numbers vary widely by country though peaking in Canada and USA with 87 percent, and Singapore with 86 percent. But, they are significantly lower in Japan with 49 percent, Slovenia 51 percent and Poland 54 percent.
Fifty percent of the respondents to the survey said things have improved but 30 percent said things were the same as in 2021. Seventy percent and 69 percent agreed that things had improved in Spain and Brazil, but only 30 percent, and 32 percent agreed that was the case in Sweden, Japan and Poland.
In the Gulf Cooperation Council (GCC), nine percent of respondents said things had got worse. Globally, those in senior positions, especially 58 percent, were more likely to report that things have improved compared with managers at 49 percent and junior staff at 42 percent.
The overall level of inclusion, calculated on the basis of answers to questions about a respondent’s sense of well-being, an absence of discrimination and a presence of negative behaviours was almost identical to 2021.
The global DEI inclusion index was 64 percent last time (69 percent for men and 61 percent for women) and this year it is 63 percent, and still 69 percent for men and 61 percent for women. For LGBQ+ respondents, the Index has fallen two points from 60 percent to 58 percent.
The three countries to record the biggest improvements were New Zealand (up 10 percentage points to 71 percent), South Africa (up seven points to 61 percent) and Ireland (up six points to 68 percent). While the biggest three declines were recorded in Hong Kong SAR (down six points to 61 percent), The Gulf Cooperation Council (down four points to 57 percent) and the Netherlands (down four points to 63 percent).
The most common forms of discrimination reported are still around age, gender and family status. Forty one percent of women, 42 percent of parents and 39 percent of caregivers feel that family responsibilities hinder one’s career.
Twelve percent of 18-24 year-olds and 17 percent of 55-64 years said they personally experienced age discrimination compared to an overall global average of eight percent.
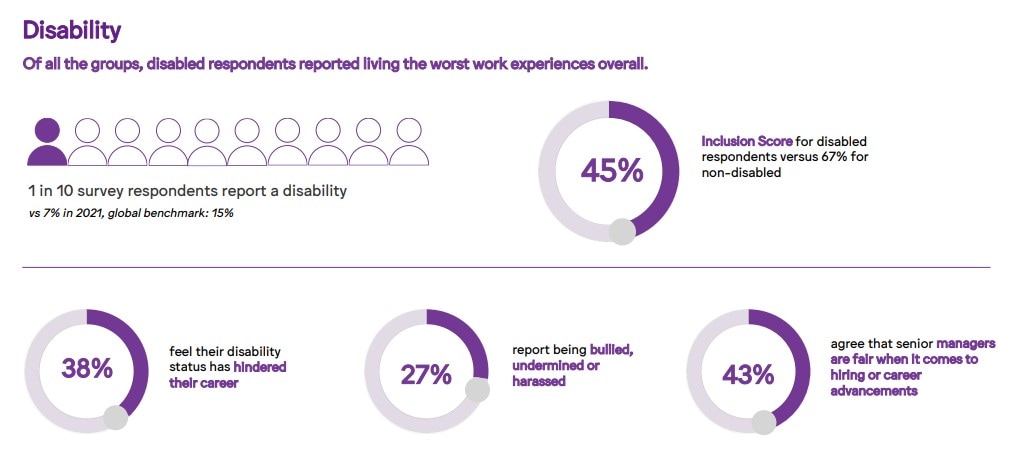
Women, LGBQ+, ethnic minority and disabled respondents still have worse experiences than their counterparts. Sixty nine percent of men reported living better work experiences than 61 percent of women. Forty five percent disabled respondents as compared to 67 percent non-disabled reported living the worst work experiences.
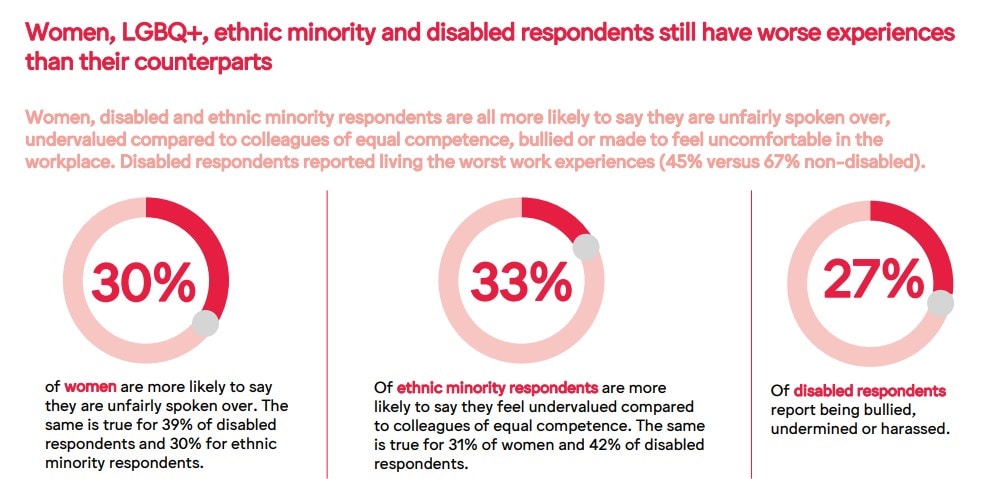
Women, disabled and ethnic minority respondents are all more likely to say they are unfairly spoken over (30 percent of women versus 21 percent men, 39 percent of disabled versus 25 percent non-disabled and 30 percent for ethnic minority respondents respectively versus 26 percent for ethnic majority respondents), undervalued compared to colleagues of equal competence (31 percent for women versus 23 percent men, 42 percent for disabled versus 26 percent for non-disabled, 33 percent for ethnic minorities versus 26 percent for their majority counterparts), bullied or made to feel uncomfortable in the workplace.
The results are based on nearly 13k responses from 91 countries, providing a detailed insight into people’s lived experiences from across the industry globally. The initiative is supported by a coalition of 10 global marketing and advertising organisations – WFA, VoxComm, Campaign, Kantar, Advertising Week, Cannes Lions, Effie Worldwide, IAA, Global Web Index (GWI) and Adweek.
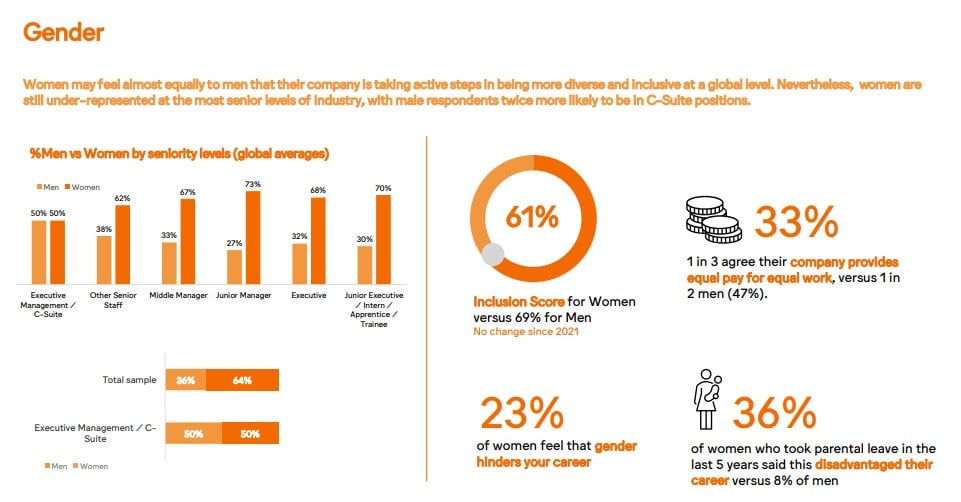
Women and ethnic minorities also report being under-represented in senior positions. Analysing function by gender, women are more likely to be in marketing or public relations and account management. Female respondents are dominant in junior positions (64 percent women vs 36 percent M) and male respondents are twice as likely to be in C-Suite positions (21 percent men vs 11 percent women).
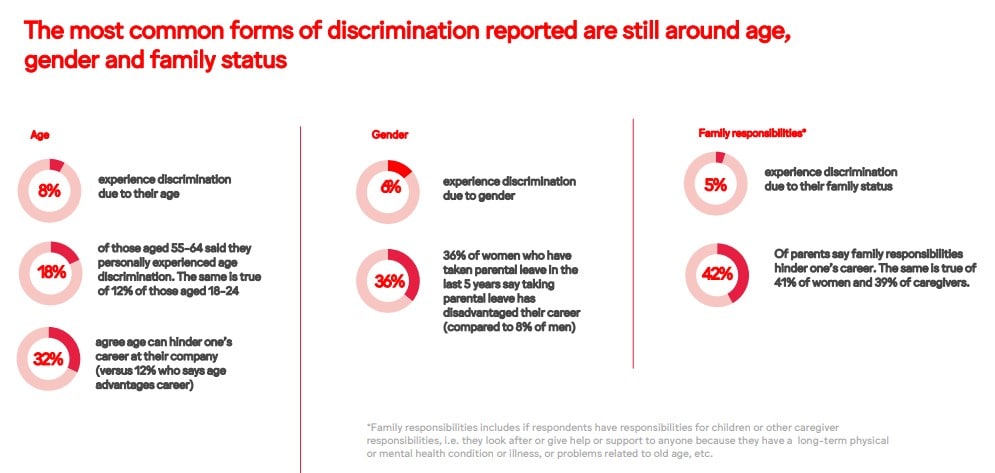
Thirty six percent of women who took parental leave in the last five years think it has put them at a disadvantage in their career compared with eight percent of men.
Additionally, nearly half of respondents still feel that promotion or hiring decisions can be discriminatory with only 55 percent agreeing with the statement “Senior management does not discriminate when it comes to hiring or career advancements of those that report into them”. This drops to 52 percent for women, 51 percent for ethnic minorities, 49 percent for LGBQ+ and just 43 percent for disabled respondents.
The 2023 number represents a slight improvement on the 51 percent scored on the same question in 2021, but Japan is currently the worst scoring market with just 34 percent agreeing.
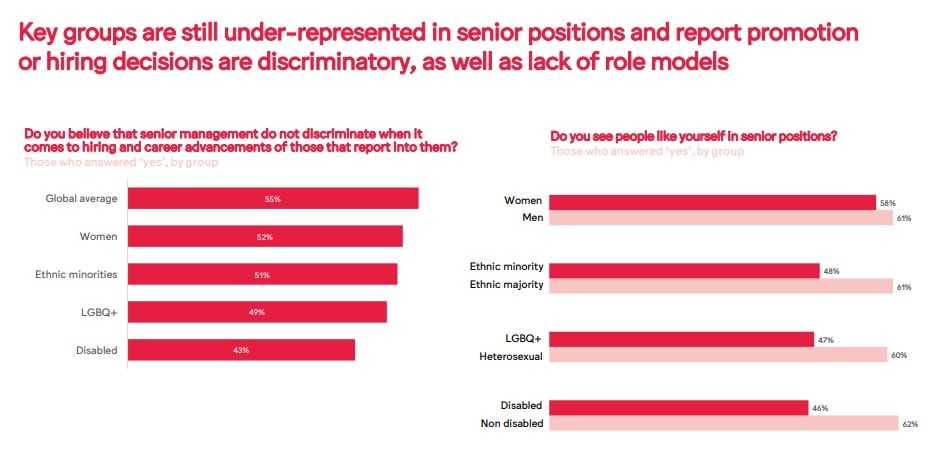
Key groups are also less likely to agree that there are people like them in senior positions in their company, highlighting a lack of role models. Women’s scores are three points down on men with 58 percent agreeing, ethnic minority respondents are 13 points down on ethnic majority at just 48 percent, LGBQ+ respondents are 13 points down on heterosexual respondents at 47 percent, while disabled respondents show the biggest gap of all, 16 points down on non-disabled at 46 percent.
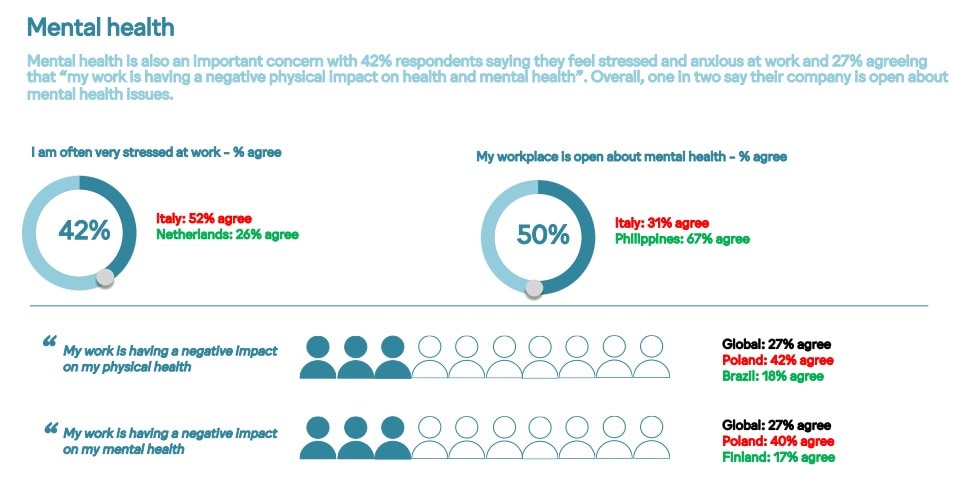
Mental health is also an important concern with 42 percent respondents saying they feel stressed and anxious at work. This peaks in Italy at 52 percent, which coincidentally is also the market with 31 percent of respondents agreeing that their company is open about mental health issues. The Netherlands report the lowest percentage, which is 26 percent of respondents who are stressed or anxious at work. Overall, one in two say their company is open about mental health issues, with the Philippines scoring best at 67 percent.
Mental health worries peak at 40 percent in Poland with 42 percent in Poland also noting the impact on their physical health. Brazil is the best place for physical health, with only 18 percent agreeing that work has a negative impact. inland is the best place for mental health, with just 17 percent citing it as a concern.